
Ethnic groups in London

London, the capital of England and the United Kingdom, has become one of the most ethnically diverse and multicultural cities in the world.
Greater London had a population of 8,899,375 at the 2021 census. Around 37% of its population were born outside the UK,[1] and over 300 languages are spoken in the region.[2][3]
History and ethnic breakdown of London[edit]


For the overwhelming majority of London's history, the population of the city was ethnically homogenous with the population being of White British ethnic origin, with small clusters of minority groups such as Jewish people, most notably in areas of the East End. From 1948 onwards and especially since the Blair government in the late 1990s and 2000s, the population has diversified in international terms at an increased rate. In 2011, it was reported for the first time that White British people had become a minority within the city, establishing it was a majority-minority city within the country. In 2005, a survey of London's ethnic and religious diversity claimed that there were more than 300 languages spoken and 50 non-indigenous communities with a population of more than 10,000 in London.[4]
| Ethnic Group | Year | |||||||||||||
|---|---|---|---|---|---|---|---|---|---|---|---|---|---|---|
| 1961 estimations[5] | 1971 estimations[6][7] | 1981 estimations[8][9] | 1991[10] | 2001[11] | 2011[12] | 2021[13] | ||||||||
| Number | % | Number | % | Number | % | Number | % | Number | % | Number | % | Number | % | |
| White: Total | 7,602,233 | 97.7% | 6,901,596 | 92.6% | 5,663,496 | 85.7% | 5,333,580 | 79.80% | 5,103,203 | 71.15% | 4,887,435 | 59.79% | 4,731,172 | 53.8% |
| White: British[Note 1] | – | – | 6,500,000 | 87% | – | – | – | – | 4,287,861 | 59.79% | 3,669,284 | 44.89% | 3,239,281 | 36.8% |
| White: Irish | – | – | 401,596 | 5.4% | – | – | 256,470 | 3.83% | 220,488 | 3.07% | 175,974 | 2.15% | 156, 333 | 1.8% |
| White: Gypsy or Irish Traveller[Note 2] | – | – | – | – | – | – | – | – | 8,196 | 0.10% | 7031 | 0.1% | ||
| White: Roma | – | – | – | – | – | – | – | – | – | – | 37,689 | 0.4% | ||
| White: Other[Note 1] | – | – | – | – | – | – | 594,854 | 8.29% | 1,033,981 | 12.65% | 1,290,838 | 14.7% | ||
| Asian or Asian British: Total | – | – | – | – | – | – | 690,031 | 10.33% | 946,894 | 13.20% | 1,511,546 | 18.49% | 1,817,640 | 20.8% |
| Asian or Asian British: Indian | – | – | – | – | – | – | 347,091 | 5.19% | 436,993 | 6.09% | 542,857 | 6.64% | 656,272 | 7.5% |
| Asian or Asian British: Pakistani | – | – | – | – | – | – | 87,816 | 1.31% | 142,749 | 1.99% | 223,797 | 2.74% | 290,549 | 3.3% |
| Asian or Asian British: Bangladeshi | – | – | – | – | – | – | 85,738 | 1.28% | 153,893 | 2.15% | 222,127 | 2.72% | 322,054 | 3.7% |
| Asian or Asian British: Chinese[Note 3] | – | – | – | – | – | – | 56,579 | 0.84% | 80,201 | 1.12% | 124,250 | 1.52% | 147,520 | 1.7% |
| Asian or Asian British: Other Asian | – | – | – | – | – | – | 112,807 | 1.68% | 133,058 | 1.86% | 398,515 | 4.88% | 401,245 | 4.6% |
| Black or Black British: Total | – | – | – | – | – | – | 535,216 | 8.01% | 782,849 | 10.92% | 1,088,640 | 13.32% | 1,188,370 | 13.5% |
| Black or Black British: African | – | – | – | – | – | – | 163,635 | 2.44% | 378,933 | 5.28% | 573,931 | 7.02% | 697,054 | 7.9% |
| Black or Black British: Caribbean | – | – | – | – | – | – | 290,968 | 4.35% | 343,567 | 4.79% | 344,597 | 4.22% | 345,405 | 3.9% |
| Black or Black British: Other Black | – | – | – | – | – | – | 80,613 | 1.20% | 60,349 | 0.84% | 170,112 | 2.08% | 145,911 | 1.7% |
| Mixed or British Mixed: Total[Note 1] | – | – | – | – | – | – | – | – | 226,111 | 3.15% | 405,279 | 4.96% | 505,775 | 5.7% |
| Mixed: White and Black Caribbean | – | – | – | – | – | – | – | – | 70,928 | 0.99% | 119,425 | 1.46% | 132,555 | 1.5% |
| Mixed: White and Black African | – | – | – | – | – | – | – | – | 34,182 | 0.48% | 65,479 | 0.80% | 77,341 | 0.9% |
| Mixed: White and Asian | – | – | – | – | – | – | – | – | 59,944 | 0.84% | 101,500 | 1.24% | 125,188 | 1.4% |
| Mixed: Other Mixed | – | – | – | – | – | – | – | – | 61,057 | 0.85% | 118,875 | 1.45% | 170,691 | 1.9% |
| Other: Total | – | – | – | – | – | – | 120,872 | 1.81% | 113,034 | 1.58% | 281,041 | 3.44% | 556,768 | 6.3% |
| Other: Arab[Note 2] | – | – | – | – | – | – | – | – | – | – | 106,020 | 1.30% | 139,791 | 1.6% |
| Other: Any other ethnic group | – | – | – | – | – | – | – | – | 113,034 | 1.58% | 175,021 | 2.14% | 416,977 | 4.7% |
| Non-White: Total | 179,109 | 2.3% | 547,588 | 7.4% | 945,017 | 14.3% | 1,346,119 | 20.2% | 2,068,888 | 28.85% | 3,286,506 | 40.2% | 4,068,553 | 46.2% |
| Total | 7,781,342 | 100% | 7,449,184 | 100% | 6,608,513 | 100% | 6,679,699 | 100.00% | 7,172,091 | 100.00% | 8,173,941 | 100.00% | 8,799,725 | 100% |
-
 White
White -
 Asian
Asian -
 Black
Black -
 White-British
 -
 White-Irish
 -
 White-Other
 -
 Asian-Indian
 -
 Asian-Pakistani
 -
 Asian-Bangladeshi
 -
 Asian-Chinese
 -
 Black-African
 -
 Black-Caribbean
 -
 Other-Arab


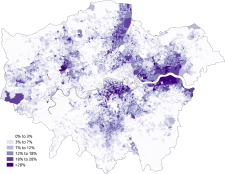
Racial breakdown of London[edit]
White population of London[edit]
At the 2011 census, the total White population of London stood at 4,887,435.[14]
| White British Population | White Irish Population | White Gypsy/Irish Traveller Population | Other White Population | Total White Population | |
|---|---|---|---|---|---|
| Inner London | 1,240,266 | 75,165 | 3,055 | 534,723 | 1,853,209 |
| Outer London | 2,429,018 | 100,809 | 5,141 | 499,258 | 3,034,226 |
| London | 3,669,284 | 175,974 | 8,196 | 1,033,981 | 4,887,435 |
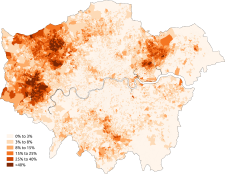
Whites form a majority of London's population and are evenly spread. Bromley has the highest White British population as well as highest total White, while Newham has the lowest for both. Brent has the highest White Irish population, while Bexley has the highest White Gypsy/Irish Traveller population and Haringey has the highest for Other White (non-British/Irish/Gypsy/Irish Traveller white).[15]
The table below shows the population by numbers in the top 20 boroughs.[16]
| Rank | London Borough | White British Population | White Irish Population | White Gypsy or Irish Traveller Population | Other White Population | Total White Population |
|---|---|---|---|---|---|---|
| 1 | Bromley | 219,493 | 4,954 | 578 | 26,719 | 251,744 |
| 2 | Barnet | 140,777 | 7,644 | 179 | 74,608 | 223,208 |
| 3 | Wandsworth | 157,048 | 8,061 | 163 | 55,131 | 220,360 |
| 4 | Havering | 174,232 | 2,894 | 259 | 19,496 | 196,881 |
| 5 | Croydon | 146,268 | 4,935 | 212 | 36,450 | 187,865 |
| 7 | Bexley | 158,824 | 2,528 | 620 | 14,872 | 176,862 |
| 8 | Lambeth | 119,395 | 6,828 | 146 | 46,872 | 173,241 |
| 9 | Enfield | 103,140 | 5,969 | 374 | 61,280 | 170,763 |
| 10 | Greenwich | 119,665 | 4,230 | 385 | 35,844 | 160,124 |
| 11 | Ealing | 89,261 | 8,511 | 248 | 59,009 | 157,033 |
| 12 | Richmond upon Thames | 123,093 | 4,886 | 85 | 22,667 | 156,711 |
| 13 | Southwark | 109,253 | 6,024 | 156 | 41,208 | 156,641 |
| 14 | Haringey | 88,424 | 6,997 | 370 | 58,552 | 154,343 |
| 15 | Lewisham | 111,726 | 5,055 | 116 | 36,819 | 153,716 |
| 16 | Hillingdon | 113,377 | 5,585 | 479 | 27,255 | 146,696 |
| 17 | Waltham Forest | 94,766 | 4,230 | 198 | 46,433 | 145,627 |
| 18 | Sutton | 120,014 | 3,118 | 130 | 19,562 | 142,824 |
| 19 | Islington | 86,092 | 7,062 | 108 | 40,634 | 133,796 |
| 20 | Camden | 74,348 | 5,325 | 128 | 44,285 | 124,086 |
| 21 | Westminster | 57,162 | 3,742 | 49 | 50,276 | 111,229 |
Black population of London[edit]
At the 2021 census, the total Black population of London stood at 1.5 million[17] This is a rise of 1.8% from the 2011 census, when the population stood at 990,000.
Inner London and Outer London have a near-equal black population. The 2011 census is the first time that the black population in Outer London has overtaken that of Inner London:
| Black African Population | Black Caribbean Population | Other Black Population | Total Black Population | |
|---|---|---|---|---|
| Inner London | 291,331 | 186,256 | 95,350 | 572,937 |
| Outer London | 288,892 | 163,826 | 76,033 | 528,751 |
| London | 580,223 | 350,082 | 171,383 | 1,101,688 |
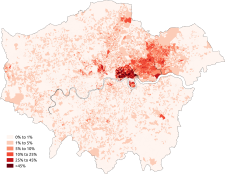
The black population of London is noticeably concentrated in South London, with the four boroughs with the highest black populations overall all south of the river, and Greenwich also featuring inside the top 10. Southwark has the highest Black African population, Croydon has the highest Black Caribbean population, and Lambeth has the highest total black population in London. In Southwark, Greenwich and Newham, the Black African population is significantly higher than Black Caribbean; conversely, Lewisham and Brent are almost balanced, and Croydon is the only borough where the Black Caribbean population nearly exceeds the Black African one.
The twenty London boroughs with the highest total Black population (Black African, Black Caribbean and Other Black) are listed below:
| Rank | London Borough | Black African Population | Black Caribbean Population | Other Black Population | Total Black Population |
|---|---|---|---|---|---|
| 1 | Croydon | 40,219 | 36,108 | 12,114 | 88,441 |
| 2 | Lewisham | 37,834 | 31,883 | 10,756 | 80,473 |
| 3 | Southwark | 48,320 | 18,156 | 10,823 | 77,511 |
| 4 | Lambeth | 37,359 | 28,991 | 9,795 | 76,145 |
| 5 | Newham | 40,874 | 13,586 | 6,842 | 61,302 |
| 6 | Enfield | 36,463 | 16,990 | 7,059 | 60,512 |
| 7 | Brent | 31,070 | 21,258 | 7,167 | 59,495 |
| 8 | Hackney | 29,478 | 17,903 | 7,264 | 54,645 |
| 9 | Greenwich | 35,164 | 8,051 | 5,440 | 48,655 |
| 10 | Haringey | 23,037 | 18,087 | 6,706 | 47,830 |
| 12 | Barking and Dagenham | 35,101 | 5,824 | 5,882 | 46,807 |
| 11 | Waltham Forest | 18,759 | 17,587 | 5,301 | 41,647 |
| 13 | Ealing | 22,578 | 12,898 | 4,015 | 39,491 |
| 14 | Wandsworth | 17,330 | 11,356 | 4,376 | 33,062 |
| 15 | Barnet | 22,670 | 4,951 | 3,031 | 30,651 |
| 16 | Islington | 18,091 | 7,368 | 3,284 | 28,743 |
| 17 | Redbridge | 14,573 | 8,452 | 3,071 | 26,096 |
| 18 | Hammersmith and Fulham | 13,234 | 6,626 | 2,584 | 22,453 |
| 19 | Merton | 12,218 | 7,632 | 3,037 | 22,887 |
| 20 | Hillingdon | 15,844 | 5,752 | 2,359 | 23,955 |
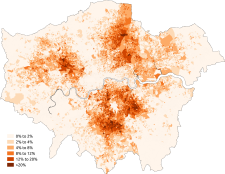
Asian population of London[edit]
At the 2011 census, the total Asian population of London stood at 1,511,546.[14] This is a rise of 60% from the 2001 census, when the population stood at 947,425.
Outer London has a greater Asian population than Inner London:
| Indian Population | Pakistani Population | Bangladeshi Population | Chinese Population | Other Asian Population | Total Asian Population | |
|---|---|---|---|---|---|---|
| Inner London | 109,933 | 59,890 | 163,838 | 65,983 | 115,549 | 515,193 |
| Outer London | 432,924 | 163,907 | 58,289 | 58,267 | 282,966 | 996,353 |
| London | 542,857 | 223,797 | 222,127 | 124,250 | 398,515 | 1,511,546 |
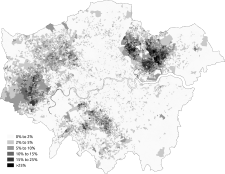
The Asian population of London is noticeably concentrated in East and West London. Harrow has the highest Indian population, Redbridge has the highest Pakistani population, Tower Hamlets has the highest Bangladeshi population and Barnet has the highest Chinese population. Newham has the highest total Asian population in London. The twenty London boroughs with the highest total Asian population (Indian, Pakistani, Bangladeshi, Chinese and Other Asian) are listed below.
| Rank | London Borough | Indian Population | Pakistani Population | Bangladeshi Population | Chinese Population | Other Asian Population | Total Asian Population |
|---|---|---|---|---|---|---|---|
| 1 | Newham | 42,484 | 30,307 | 37,262 | 3,930 | 19,912 | 133,895 |
| 2 | Redbridge | 45,660 | 31,051 | 16,011 | 3,000 | 20,781 | 116,503 |
| 3 | Brent | 58,017 | 14,381 | 1,749 | 3,250 | 28,589 | 105,986 |
| 4 | Tower Hamlets | 6,787 | 2,442 | 81,377 | 8,109 | 5,786 | 104,501 |
| 5 | Harrow | 63,051 | 7,797 | 1,378 | 2,629 | 26,953 | 101,808 |
| 6 | Ealing | 48,240 | 14,711 | 1,786 | 4,132 | 31,570 | 100,439 |
| 7 | Hounslow | 48,161 | 13,676 | 2,189 | 2,405 | 20,826 | 87,257 |
| 8 | Hillingdon | 36,795 | 9,200 | 2,639 | 2,889 | 17,730 | 69,253 |
| 9 | Barnet | 27,920 | 5,344 | 2,215 | 8,259 | 22,180 | 65,918 |
| 10 | Croydon | 24,660 | 10,865 | 2,570 | 3,925 | 17,607 | 59,627 |
| 11 | Waltham Forest | 9,134 | 26,347 | 4,632 | 2,579 | 11,697 | 54,389 |
| 12 | Merton | 8,106 | 7,337 | 2,216 | 2,618 | 15,866 | 36,143 |
| 13 | Camden | 6,083 | 1,489 | 12,503 | 6,493 | 8,878 | 35,446 |
| 14 | Enfield | 11,648 | 2,594 | 5,599 | 2,588 | 12,464 | 34,893 |
| 15 | Wandsworth | 8,642 | 9,718 | 1,493 | 3,715 | 9,770 | 33,338 |
| 16 | Westminster | 7,213 | 2,328 | 6,299 | 5,917 | 10,105 | 31,862 |
| 17 | Greenwich | 7,836 | 2,594 | 1,645 | 5,061 | 12,758 | 29,894 |
| 18 | Barking and Dagenham | 7,436 | 8,007 | 7,701 | 1,315 | 5,135 | 29,594 |
| 19 | Southwark | 5,819 | 1,623 | 3,912 | 8,074 | 7,764 | 27,192 |
| 20 | Kingston Upon Thames | 6,325 | 3,009 | 892 | 2,883 | 13,043 | 26,152 |
Foreign-born population[edit]
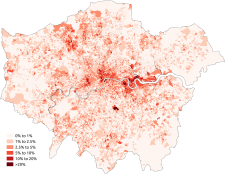
At the 2011 census, 36.7% of London's population was foreign born (including 24.5% born outside of Europe),[18] with 3,082,000 residents born abroad in 2014.[19] London has the largest population number (not percentage) of foreign-born residents of any UK city.[19]
| Population born in the UK | Population Foreign-Born | |
|---|---|---|
| Inner London | 2,012,000 | 1,325,000 |
| Outer London | 3,348,000 | 1,757,000 |
| London | 5,359,000 | 3,082,000 |
| % born in the UK | % Foreign-Born | |
|---|---|---|
| Inner London | 57.8 | 42.2 |
| Outer London | 66.9 | 33.1 |
| London | 63.3 | 36.7 |
Significant ethnic minority communities[edit]
Afghans[edit]
There is an Afghan refugee community in London.[20]
Arabs[edit]

Significant migration from Arab countries to the UK began in the 1940s, mostly by Egyptians. Other waves followed, such as Lebanese fleeing the civil war. The centre of London has a thriving Arab community, centred around Edgware Road.[21]
Bangladeshis[edit]

A major wave of immigration began in the 1970s, as people from the Sylhet Division arrived in London, fleeing poverty and the Bangladesh Liberation War. Many settled around Spitalfields, where they entered the textile trade. This trade has declined causing unemployment, but the community has moved into other businesses, including restaurants and banking. The level of immigration peaked in 1986 and has since entered a decline with the introduction of stricter immigration laws.
The community remains concentrated around Whitechapel and has spread into other east London boroughs. London as a city is home to the single largest number of people of Bangladeshi origin outside of Bangladesh, with close to 200,000 individuals being of full Bangladeshi origin in 2007.
The community also annually hosts Europe's largest outdoor Asian event known as the Boishakhi Mela in Bethnal Green as part of the Bengali New Year celebrations.
Chinese[edit]
Chinese people constitute the fourth largest Asian group in London (behind the Indians, Pakistanis and Bangladeshis respectively); numbering 114,800 in 2007, they are spread more or less across the entire city and have become successful in British life, especially when it comes to cuisine. The history of the Chinese in London is long and complex, with the first Chinese people arriving in the city in the 19th century as sailors.
Germans[edit]

Fiona Moore, author of "The German School in London, UK: Fostering the Next Generation of National Cosmopolitans?", wrote that the London German community "relies on subtle network connections rather than the displaying of obvious membership traits", since London Germans attended the same churches, joined the same clubs, and sent their children to the same schools.[22] According to Moore this aspect was likely influenced by the outcomes of World War I and World War II, resulting in encouragement for UK-based Germans "to try to blend in to a greater degree than elsewhere."[22]
The German business and expatriate community is centred on the London Borough of Richmond upon Thames, which houses the German School London (DSL) and most German expatriates residing in London. Moore wrote that the borough "does not immediately show signs of hosting a German community" due to a lack of obvious German businesses and storefronts,[22] but that most residents know of the location of the DSL and that there are "more subtle signs of German presence."[23]
German expatriates are located throughout London. Some of them do not go to the Borough of Richmond upon Thames even though the centre of the German community is located there.[22]
Ghanaians[edit]
Besides Nigerians, Ghanaians are one of the largest Black African groups in London, with the majority living in the boroughs of Southwark, Lambeth, Newham, Hackney, Haringey, Lewisham, Merton, Waltham Forest, Croydon, Enfield and Brent.[24]
Greeks[edit]
According to the "History of London's Greek community" by Jonathan Harris,[25] the Greek population of London numbered several thousand by 1870 AD whereas in 1850 AD it was just a few hundred. The 2001 Census recorded 12,360 Greek-born people living in London, with particular concentrations in the Hyde Park, Regent's Park, Chelsea and Kensington Census tracts.[26]
The Census tracts with the highest number of Cypriot-born people in 2001 were Palmers Green, Upper Edmonton, Cockfosters, Lower Edmonton, Tottenham North and Tottenham South.[27] Many Greek-Cypriots reside in Wood Green, Harringay and Palmers Green, the latter harbouring the largest community of Greek-Cypriots outside Cyprus, resulting in these areas bearing local nicknames whereby the Green is replaced by Greek – as in Greek Lanes and Palmers Greek.[28][29][30]
According to a City of London Corporation sponsored report,[31] there are between 280,600 and 310,000 Greek speakers in Greater London.
The Greek Primary School of London and the Greek Secondary School of London both serve the community.
Indians[edit]
British Indians have long been one of London's largest ethnic minority groups and in 2007 over 500,000 Indians were residing in London (this excludes people of half or less Indian origin). Around 7% of London's population is of Indian origin. Indians have been in the British capital for generations and come from all walks of life. They are influential in the city's culture and are major contributors to London's workforce and economy.
Southall, Hounslow and Wembley have significant Indian populations.
Irish[edit]
Irish migration to Great Britain has a lengthy history due to the close proximity of, and complex relationship between, the islands of Ireland and Great Britain and the various political entities that have ruled them. Today, millions of residents of Great Britain are either from the island of Ireland or have Irish ancestry. Around six million Britons have an Irish grandfather or grandmother (approximately 10% of the UK population).[32] 900,000 ethnic Irish people live in the capital (12% of the city's population); despite this, some sources put the population of people of Irish descent in London at 77% (some five and a half million people), although the White British and White Irish populations combined are less than this.[33][34] The highest numbers of the Irish population is in the North and West London boroughs of Brent and Ealing.[15]
Jamaicans[edit]
There are records that show black people, predominantly from Jamaica, living in London during the 17th and 18th centuries; but it was not until the arrival of the HMT Empire Windrush, on 22 June 1948, that significant numbers of Caribbeans, in particular Jamaicans, arrived in the capital. This has since become an important landmark in the history of modern multicultural Britain. During the post World War II era, the presence of the Caribbean Community was requested to help reconstruct the British economy. Employers such as British Rail, the NHS and London transport recruited almost exclusively from Jamaica. Some 250,000 Londoners are of Jamaican origin.[35] Brixton and Harlesden are considered the community's cultural capitals.[36][37]
Japanese[edit]

Junko Sakai, author of Japanese Bankers in the City of London: Language, Culture and Identity in the Japanese Diaspora, stated that there is no particular location for the Japanese community in London, but that the families of Japanese "company men" have a tendency of living in North London and West London. Japanese restaurants and shops are located around these groups of Japanese people.[38]
Jews[edit]
Jews are an ethnic and religious minority, and are protected under the Race Relations Act.[39][40] London has the second largest Jewish community in Europe after Paris, numbering some 160,000, particularly in North London. Districts with a high concentration include Finchley, Mill Hill, Edgware, Stanmore, Golders Green, Hendon, Hampstead Garden Suburb, Highgate, and further east the Hasidic-strong exclave in Stamford Hill & South Tottenham.
Koreans[edit]

As of 2014 there were about 10,000 ethnic Koreans in New Malden proper,[41] and as of the same year the Korean population in the area around New Malden is around 20,000, including about 600 originating from North Korea, giving it the largest group of North Koreans in Europe.[42] Many of the Koreans living in New Malden work for Korean companies, and they are either permanently settled and formerly expatriate, or they are still expatriates.[43] In 2015 Paul Fischer of The Independent wrote that the North Koreans were insular, and that there were tensions between the South Korean majority and the North Koreans in New Malden.[41]
The New Malden area has Korean-language churches and nursery schools as well as restaurants and shops with Korean clientele.[44] The area has Korean supermarkets, about 20 Korean restaurants and cafes,[41] including those serving bulgogi.[41] It also has a noraebang (Karaoke bar).[42] The Korean language is visible on several shop signs. The original Embassy of South Korea to the United Kingdom is in Malden.[41]
Some factors cited in The Telegraph as reasons why the Korean community formed in New Malden included a 1950s joint venture partnership between a chaebol and Racal Avionics (formerly Dacca), Lord Chancellor's Walk in Coombe Lane West previously serving as the residence of the Ambassador of South Korea to the United Kingdom, and Samsung Electronics having its UK offices in New Malden until they moved to their current location in Chertsey, Surrey in 2005. Many Koreans settled in New Malden in the 1970s due to the ambassador's location.[42]
There is a newspaper published in New Malden, Free NK, which is opposed to the government of North Korea.[42]
Lithuanians[edit]

The Lithuanian community in London goes back to at least the early 20th century. Most of the community came in a wave of Eastern European immigration in the 2000s, after Lithuania joined the European Union.[45]
Most of London's Lithuanians live in the boroughs of Barking and Dagenham, Newham, Redbridge and Waltham Forest, with smaller numbers elsewhere. The main Lithuanian-speaking Roman Catholic church, St Casimir's, however, lies in Cambridge Heath.[45]
Nigerians[edit]
London (in particular the southern boroughs) is home to the largest Nigerian community in the UK, and possibly the largest overseas Nigerian community in the world. The first recorded Nigerian in London was Olaudah Equiano who came to Britain after escaping from slavery over 200 years ago, becoming a member of the abolitionist Sons of Africa group.
In the mid-20th century a wave of Nigerian immigrants came to London. Civil and political unrest in the country contributed to numerous refugees arriving in England.[46] The vast majority of famous and notable British people of Nigerian origin were either born in or now live in London.
Peckham (also known as Little Lagos and Yorubatown) is home to one of the largest overseas Nigerian communities in the world; many of the local establishments are Yoruba-owned. Nigerian churches and mosques can be found in the area. As immigrants become assimilated, English is becoming the predominant language of the local Nigerian British population. The Yoruba language is declining in use in the Peckham area despite the increasing Nigerian population.[47] In 2001, about 7% of Peckham's population was born in Nigeria.[48] A much larger proportion of the ward's 60% Black population is of Nigerian descent, as 40% are of other African descent.[49]
Pakistanis[edit]

Pakistanis in London form the largest concentrated community of British Pakistanis; immigration from regions which now form Pakistan predate Pakistan's independence.[50] The main concentrations of Pakistani settlement in London are found in Outer London with the boroughs of Redbridge, Newham and Waltham Forest accounting for nearly a third of Londoners of Pakistani descent.
Polish[edit]

London has had a notable Polish community since the Second World War. Many of the migrants from Poland in the 1940s were soldiers and their families. The Polish Government in Exile was based in London until it was dissolved in 1991 following the restoration of democracy in Poland. In the 2000s a wave of Polish immigrants came to Britain, including London, after Poland joined the European Union. As of 2016, Poles now account for about 4.5 per cent of London's foreign-born population.[51]
The boroughs of Ealing, Enfield, Kensington and Chelsea, Haringey, Lambeth, Lewisham and Wandsworth have significant numbers of Poles living there. The Church of the Evangelist in Putney is one of several Polish-speaking Roman Catholic churches in London, and the Polish Social and Cultural Association in Hammersmith is the community's main centre. Polish-style shops, with their distinctive red and white signs accompanied by words in the Polish language, can be found in many parts of London.[52]
Romanian[edit]
There has been a growing Romanian community in London since World War II. In the 2000s a wave of Romanian immigrants came to the UK, including London, after Romania joined the European Union.
A particularly concentrated community exists in the Edgware-London suburb of Burnt Oak which has gained the nickname "Little Romania" or "Little Bucharest".[53] Most Romanians belong to the Romanian Orthodox religion.[54]
Romanis[edit]
Romani people are concentrated in north and east London. Approximately 30,000 Roma and Travellers live in London.[55]
Sri Lankans[edit]
There is a large Sri Lankan community in London. The population of Sri Lankans in London was 50,000 in 2001 and 84,000 in 2011.[56][57] British Sri Lankans in London (mainly Tamils) can be found in Harrow (West London) and Tooting (South London).[58] They have a long presence in the UK dating back to the colonial times in the 19th century.[59] However, the majority came as refugees during the Sri Lankan Civil War.[60]
South Africans[edit]
More than 53,000 South Africans live in London.[61]
Thai[edit]
Turkish[edit]
London is home to the largest Turkish community in the UK. The boroughs of Enfield, Haringey and Hackney have a significant number of Turkish inhabitants. A large Turkish-cypriot community is also present in boroughs of South London such as Lambeth and Croydon.
Gallery[edit]
-
 London's Irish community celebrating Saint Patrick's Day.
 -
 Chinatown, London during Chinese new year.
 -
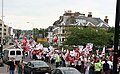 London Turks protesting.
 -
-
 Kittitian and Nevisian street dancers at the Notting Hill Carnival.
 -
 Large numbers of Colombians live in London.
 -


See also[edit]
Notes[edit]
References[edit]
- Moore, Fiona. "The German School in London, UK: Fostering the Next Generation of National Cosmopolitans?" (Chapter 4). In: Coles, Anne and Anne-Meike Fechter. Gender and Family Among Transnational Professionals (Routledge International Studies of Women and Place). Routledge, 6 August 2012. ISBN 1134156200, 9781134156207.
Reference notes[edit]
- ^ "Migration statistics - House of Commons Library". House of Commons Library. 24 November 2022. Retrieved 6 December 2022.
- ^ "Languages in London - Multilingual Capital". Multilingual Capital. Queen Mary University of London. Retrieved 28 July 2018.
- ^ "CILT, the National Centre for Languages". 13 February 2005. Archived from the original on 13 February 2005. Retrieved 24 January 2021.
- ^ Benedictus, Leo (25 January 2005). "Every race, colour, nation and religion on earth". The Guardian. Retrieved 22 August 2009.
- ^ Lee, Trevor R. (30 June 2010). "Immigrants in London: Trends in distribution and concentration 1961–71". Journal of Ethnic and Migration Studies. 2 (2): 145–158. doi:10.1080/1369183x.1973.9975191. ISSN 1369-183X.
- ^ Goodhew, David; Cooper, Anthony-Paul (2018), "The Desecularisation of the City: London's Churches, 1980 to the Present", The Desecularisation of the City, pp. 3–38, doi:10.4324/9781351167765-1, ISBN 978-1-351-16776-5, S2CID 240171114, retrieved 4 December 2022
- ^ Jones, P. N. (1978). "The Distribution and Diffusion of the Coloured Population in England and Wales, 1961-71". Transactions of the Institute of British Geographers. 3 (4): 515–532. Bibcode:1978TrIBG...3..515J. doi:10.2307/622127. ISSN 0020-2754. JSTOR 622127. PMID 12157820.
- ^ Equality, Commission for Racial (1985). "Ethnic minorities in Britain: statistical information on the pattern of settlement". Commission for Racial Equality: Table 2.2.
- ^ Peach, Ceri (1 July 1986). "A geographical perspective on the 1981 urban riots in England". Ethnic and Racial Studies. 9 (3): 396–411. doi:10.1080/01419870.1986.9993541. ISSN 0141-9870.
- ^ Data is taken from United Kingdom Casweb Data services of the United Kingdom 1991 Census on Ethnic Data for England, Scotland and Wales Archived 5 April 2022 at the Wayback Machine (Table 6)
- ^ "Office of National Statistics; 2001 Census Key Statistics". webarchive.nationalarchives.gov.uk. Retrieved 7 September 2021.
- ^ "2011 Census: Ethnic Group, local authorities in England and Wales". webarchive.nationalarchives.gov.uk. Retrieved 15 December 2021.
- ^ "Ethnic group - Office for National Statistics". www.ons.gov.uk. Retrieved 29 November 2022.
- ^ a b "Ethnic Groups in London". Census Update. 2011. Office for National Statistics: 1. 11 December 2012. Retrieved 12 December 2011.
- ^ a b "[ARCHIVED CONTENT] UK Government Web Archive - The National Archives". Archived from the original on 8 January 2016. Retrieved 9 November 2020.
{{cite web}}: CS1 maint: bot: original URL status unknown (link) - ^ "Ethnic group, England and Wales - Office for National Statistics". www.ons.gov.uk. Retrieved 2 June 2024.
- ^ "Ethnic group, England and Wales - Office for National Statistics". www.ons.gov.uk. Retrieved 2 June 2024.
- ^ "A summary of countries of birth in London". Census Update. 2011. Office for National Statistics: 1. 11 December 2012. Retrieved 12 December 2011.
- ^ a b "UK Government Web Archive". webarchive.nationalarchives.gov.uk. Retrieved 8 March 2024.
- ^ Miller, Frederica (17 December 2018). "'Idiots tell me to leave' - Life as an Afghan refugee in London". My London. Retrieved 8 March 2024.
- ^ "Arabic London". BBC. 30 April 2008. Retrieved 24 May 2016.
- ^ a b c d Moore, Google Books PT89 (actual page number unstated).
- ^ Moore, Google Books PT90 (actual page number unstated).
- ^ Arthur, Mr John (2008). Ghanaian London. Ashgate Publishing. ISBN 978-0-7546-4841-3. Retrieved 3 January 2010.
- ^ "History of the Greek Community that found the Greek Orthodox Cathedral of Saint Sophia (Divine Wisdom)". 29 September 2006. Archived from the original on 29 September 2006. Retrieved 1 June 2021.
- ^ "Born abroad: Greece". BBC. 7 September 2005. Retrieved 7 December 2008.
- ^ "Born abroad: Cyprus". BBC. 7 September 2005. Retrieved 7 December 2008.
- ^ "Things you didn't know about... Palmers Green", Archived 26 October 2008 at the Wayback Machine Yellow Pages
- ^ "Greek in Palmers Green", UKTV
- ^ "Palmers Green Archived 29 August 2009 at the Wayback Machine", Trusted Places
- ^ Philip Baker & John Eversley, Multilingual Capital, commissioned by City of London Corporation, published by Battlebridge 2000.
- ^ Bowcott, Owen (13 September 2006). "Six million Britons are entitled to Irish citizenship". The Guardian. London. Retrieved 3 January 2010.
- ^ "Irish in London". Merseyreporter.com. Retrieved 3 January 2010.
- ^ "Irish in London 2". BBC News. 16 March 2001. Retrieved 3 January 2010.
- ^ "Jamaica Mapping Exercise" (PDF). International Organization for Migration. Archived from the original (PDF) on 11 May 2011. Retrieved 22 April 2010.
- ^ "African Caribbean Culture In The United Kingdom Marketing Essay". UKEssays.com. Retrieved 1 June 2021.
- ^ joysigaud (13 October 2020). "Black London, Harlesden Through The Lens". Editions Lifestyle Black History Month & Windrush Magazines, Newsletters. Retrieved 1 June 2021.
- ^ Sakai, Page unstated (PT67). "Although the Japanese have no precise geographical location for their community, they are connected with each other personally, and one of their geographical centres is the Japanese school in London, previously in North London and now in West Acton."
- ^ "Are Jews an ethnic minority? The BBC doesn't think so - The Jewish Chronicle". Archived from the original on 9 November 2020.
- ^ "British Jews are urged to 'rebrand' as ethnic minority". The Independent. 16 August 2013. Retrieved 1 June 2021.
- ^ a b c d e Fischer, Paul. "The Korean Republic of New Malden: How Surrey became home to the 70 year-old conflict." The Independent. Monday 23 February 2015. Retrieved 2 November 2015.
- ^ a b c d Parrish, Charlie. "Why is New Malden home to more North Koreans than any other place in Europe?" The Daily Telegraph. 6 October 2014. Retrieved 2 November 2015.
- ^ Moore, Fiona. "The German School in London, UK: Fostering the Next Generation of National Cosmopolitans?" (Chapter 4). In: Coles, Anne and Anne-Meike Fechter. Gender and Family Among Transnational Professionals (Routledge International Studies of Women and Place). Routledge, 6 August 2012. ISBN 1134156200, 9781134156207. CITED: Google Books PT90.
- ^ Moore, Fiona. "The German School in London, UK: Fostering the Next Generation of National Cosmopolitans?" (Chapter 4). In: Coles, Anne and Anne-Meike Fechter. Gender and Family Among Transnational Professionals (Routledge International Studies of Women and Place). Routledge, 6 August 2012. ISBN 1134156200, 9781134156207. CITED: Google Books PT89-PT90.
- ^ a b "London, England". Global True Lithuania. Retrieved 3 January 2017.
- ^ Nigerian London (20 August 2008). "Nigerian London". BBC. Retrieved 3 January 2010.
- ^ "Little Lagos in south London". BBC News. 25 January 2005. Retrieved 17 May 2017.
- ^ "UK statistics on Nigerian-born people in Britain". BBC News. 7 September 2005. Retrieved 3 January 2010.
- ^ Neighbourhood Statistics. "Pecham Ethnicity, 2001". Neighbourhood.statistics.gov.uk. Archived from the original on 29 March 2009. Retrieved 3 January 2010.
- ^ "Pakistani London". BBC. 26 May 2005. Retrieved 18 September 2013.
- ^ "What do London's Poles feel about Brexit?". Londonist. 29 June 2016. Retrieved 2 January 2017.
- ^ "Opinion: will Brexit spell the demise of Polish shops in London?". Calvert Journal. 14 July 2016. Archived from the original on 3 January 2017. Retrieved 3 January 2017.
- ^ McNamara, Paul (1 December 2016). "Immigration: The suburb in London dubbed 'Little Romania'". Channel 4 News. Retrieved 15 August 2021.
- ^ "Parohia Sf. Gheorghe Londra".
- ^ "Home".
- ^ "BBC NEWS | UK | Born Abroad | Sri Lanka". news.bbc.co.uk. Retrieved 8 March 2024.
- ^ Aspinall, Peter J. (2019). "The Sri Lankan community of descent in the UK: A neglected population in demographic and health research". South Asian Diaspora. 11: 51–65. doi:10.1080/19438192.2018.1505065. S2CID 149483258.
- ^ "Next year in Jaffna". The Economist. 21 January 2010.
- ^ Wijenayake, Nandasinghe Arachchige Jitendra (2019). The Sinhalese Buddhist diaspora in the United Kingdom: negotiating Sinhalese identity (PDF) (PhD). Liverpool John Moores University. OCLC 1197754531. Retrieved 3 March 2023.
- ^ "Archived copy" (PDF). snis.ch. Archived from the original (PDF) on 14 May 2016. Retrieved 27 April 2022.
{{cite web}}: CS1 maint: archived copy as title (link) - ^ McLaughlin, Connor (21 June 2021). "UK the second most popular destination for emigrating South Africans". South West Londoner. Retrieved 8 March 2024.
Further reading[edit]
- Cherti, Miriam. Paradoxes of Social Capital: A Multi-generational Study of Moroccans in London (IMISCOE dissertations Sussex theses; S 6271). Amsterdam University Press, 2008. ISBN 9053560327, 9789053560327.
External links[edit]
- Ethnicity Profiles: London by the Commission for Racial Equality
- Mapping Where Immigrants Settle in London, Street by Street