
Mýrdalsjökull
| Mýrdalsjökull | |
|---|---|
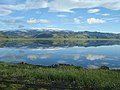
 Aerial view of Mýrdalsjökull. | |
| Type | Ice cap |
| Location | Southwestern Iceland |
| Area | 520 km2 (200 sq mi)[1] |
| Thickness | Average 230 m (750 ft)[2]: 184 |
| Highest elevation | 1,450 metres (4,760 ft) [2] |
| Terminus | Sléttjökull, Öldufellsjökull, Sandfellsjökull, Kötlujökull, Huldujökull, Mosakambsökull, Klifurárjökull, Sólheimajökull, Jökulsárgilsjökull, Hrunajökull, Tungnakvíslarjökull, Goðalandsjökull, Hrútárökull, and Entujökull [3] |
| Status | Retreating |
 Map of Mýrdalsjökull glacier showing its named outlet glaciers and glacial catchments (light grey shading with white outline).[a] Clicking on the map to enlarge it enables mouse over that allows identification of individual glaciers. | |
Mýrdalsjökull (pronounced [ˈmirˌtalsˌjœːkʏtl̥] , Icelandic for "(the) mire dale glacier" or "(the) mire valley glacier") is an ice cap in the south of Iceland. It is to the north of Vík í Mýrdal and to the east of the smaller ice cap Eyjafjallajökull. Between these two glaciers is the Fimmvörðuháls pass. Its recent peak ice cover has reached 1,493 m (4,898 ft) in height and in the year 1980 it covered an area of approximately 595 km2 (230 sq mi).[6] In 2016 the covered area of Mýrdalsjökull was believed to be 540 km2 (210 sq mi).[7] The area was 520 km2 (200 sq mi) in 2019.[1] The volume of ice is about 140 km3 (34 cu mi).[2]: 184 The glacier contributes to the most serious natural hazard area of Iceland.[8]
Setting[edit]
The icecap of the glacier covers an active volcano called Katla. The caldera of the volcano has a diameter of 10 km (6 mi) and the volcano erupts usually every 40–80 years. The last eruption took place in 1918. Scientists are actively monitoring the volcano, particularly after the eruption of nearby Eyjafjallajökull began in April 2010. There is a further historic relationship with Eyjafjallajökull as the two glaciers were continuous as a single ice cap at the end of the 19th century and only separated into the larger Mýrdalsjökull and smaller Eyjafjallajökull in the middle of the twentieth century.[5]: 4 Since the year 930, 16 eruptions have been documented and in the last 8400 years about 300 explosive basalt eruptions are known to have originated from Katla.[2]: 184
The glacier covers Katla mountain which while 30–35 km (19–22 mi) in diameter at its base, has a diameter closer to 20 km (12 mi) at 700 m (2,300 ft) elevation. The lowest pass out of the caldera is at 740 m (2,430 ft). This caldera is between 650–750 m (2,130–2,460 ft) deep and is surrounded by a rim of 1,300–1,380 m (4,270–4,530 ft) high mountains.[2]: 184
The Eldgjá, a volcanic eruption fissure about 30 km (19 mi) long, which erupted in the year 939, is part of the same volcanic system.[9]
Before the Hringvegur (the main ring road round the island) was built, people feared traversing the plains in front of the volcano because of the frequent jökulhlaups (glacial floods) and the deep rivers to be crossed, although the road is still vulnerable to major events. Especially dangerous was the glacial flood after the eruption of 1918 when the coastline was extended by 5 km (3.1 mi) by laharic flood deposits.
Mýrdalsjökull is an exceedingly wet location, with models suggesting it receives more than 10 metres of precipitation annually.[5]: 10
Glaciation History[edit]
The last glacial period came to an end 11,500 years ago and was followed by the Holocene. Mýrdalsjökull is likely to have been present throughout the Holocene and definitely the last 8400 years as there is no evidence of degassed erupted tephra from Katla.[2]: 186–7 Jökulhlaup's 8000 to 6000 years ago took a path over the highest pass in the caldera wall which does not support a crater lake source but would happen with an ice cap.[2]: 187
Until the development of remote satellite imaging it was impossible to monitor to annual accuracy the mass balance of Mýrdalsjökull.[10]: 572 Such techniques allowed it to be determined for Mýrdalsjökull that it is the summer temperatures that are the predominant driving factor in the recent recession of the glacier.[10]: 572 However past proxy means of measurement such as outlet length of the Sólheimajökull outlet glacier were also consistent with this.[5]: 18 Any such studies related to climate change have to be qualified as past volcanic processes have resulted in the loss of up to 5% of the ice cap on more than one occasion.[8]: Introduction
Jökulhlaups[edit]
There is complexity with assigning the outlet glacier catchments, but from the point of view of hazard assessment related to the glaciers this is simplified considerably, as the hazard risk of jökulhlaups relates to water drainage sectors based upon the ice caps surface topography rather than ice flow.[11]: 268 Such an approach creates three drainage sectors which do not reflect intracaldera bedrock topography or many of the outlet glaciers.[4]: 12 [b]
The biggest Mýrdalsjökull jökulhlaups, as in the 1775 eruption, are massive floods by any standard with maximum discharges of the order of several 100,000 m3/s (3,500,000 cu ft/s) ten to a hundred times other recent jökulhlaup's in Iceland.[c] Most recent jökulhlaup (17 out of the 20 since the year 874) have descended to the east through Kotlujökull onto the Mýrdalssandur plain with about two floods a century (i.e. presently overdue). This Ko sector has about 60 km2 (23 sq mi) within the caldera rim but underlies about 323 km2 (125 sq mi) of the ice cap itself.[d][5]: 5–6 [1]}} However due to location factors of the original melt water, the Katla 934 and 1860 jökulhlaups also descended through Sólheimajökull to the Sólheimasandu flood plain. This So sector has about 19 km2 (7.3 sq mi) of its water drainage catchment within the caldera rim and a total ice cap catchment of 108 km2 (42 sq mi).[d] There have been 5 jökulhlaups since 874. It is perhaps not so significant from a hazard point of view as the 23 km2 (8.9 sq mi) water drainage catchment within the caldera rim northwest through Entujökull where a large jökulhlaup occurred in 874. This En sector with total ice cap catchment of about 167 km2 (64 sq mi),[d] has rare but very large jökulhlaups every 500 to 800 years down the fairly well populated and developed Markarfljótsaurar flood plain.[4][5]: 5–6
Jökulhlaup triggering can be complex and results from geothermal processes, ice dams and their sudden removal by floating as well as eruptions which can be primary or secondary to the removal of overpressure.[11]. Björnsson originally described 12 geothermal ice caldrons and three eruption sites since 1755 associated with Mýrdalsjökull[11]: 258 . Later work has mapped 17 ice caldrons, all associated with the caldera of Katla and three areas of increased seismic activity, that have been postulated to be likely jökulhlaup sources, being Austmannsbunga in the north-east of the caldera and the 1755 and 1823/1918 eruption sites to the west and south as noted by Björnsson.[4]: 28, 31 . Smaller and more frequent jökulhlaups tend to be associated with the geothermal ice caldron process.
The most likely next very disruptive volcanogenic jökulhlaup will almost certainly flow from Kotlujökull, over Mýrdalssandur to the sea.[4]: 28, 31 This has been assigned a 89% probability within 30 years, affecting possibly the town of Vík, likely associated with eruption of 1.5 km3 (0.36 cu mi) of tephra (so disruptive to air travel)[e] and likely occurring in the months June to September.[4]: 74 There is a lower probability of an Entujökull jökulhlaup of the same size which is expected to have far graver environmental, social and geomorphological consequences affecting the town of Hvolsvöllur and surrounds.[4]: 74
-
-
 Mýrdalsjökull
 -
 An "ice castle" formation on Mýrdalsjökull
 -
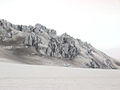
 Mýrdalsjökull glacier covered volcanic ash
 -
 Outlet glacier Sólheimajökull


See also[edit]
- Geography of Iceland
- Glaciers of Iceland
- Iceland plume
- List of lakes in Iceland
- List of islands of Iceland
- List of volcanoes in Iceland
- List of rivers of Iceland
- Volcanism of Iceland
- Waterfalls of Iceland
- List of glaciers
Notes[edit]
- ^ All mappings of Mýrdalsjökull catchments identified had elements that suggest only partial mapping of ice catchments for Mýrdalsjökull may exist hence the area of uncertainty assigned to Mýrdalsjökull in this mapping. Different mappings exist in some of the sources used in this article.[4][5]
- ^ See[4]: Fig 3a for main flood routes since 1600 and [4]: Fig. 9b for latest surface water drainage map
- ^ See for example.[8]: Section:debris Known as 'Jökull' Other sources in the same volume of that journal rise to the theme but many other authors in the literature seem concerned about the smaller twice a century floods that are comparable with jökulhlaups elsewhere in Iceland, not those every 500 years or so in their risk assessments.[4]
- ^ a b c This total size is as published in 2000 and can be estimated to be about 20% smaller in 2019 but no up to date watershed area data could be identified.
- ^ see Katla (volcano), Eyjafjallajökull, 2010 eruptions of Eyjafjallajökull, Effects of the April 2010 Eyjafjallajökull eruption and Air travel disruption after the 2010 Eyjafjallajökull eruption articles.
References[edit]
- ^ a b c Hannesdóttir, H.; Sigurðsson, O.; Þrastarson, R.H.; Guðmundsson, S.; Belart, J.M.; Pálsson, F.; Magnusson, E.; Víkingsson, S.; Kaldal, I.; Jóhannesson, T. (2020). "A national glacier inventory and variations in glacier extent in Iceland from the Little Ice Age maximum to 2019". Jökull. 12: 1–34. doi:10.33799/jokull2020.70.001.: 2
- ^ a b c d e f g Oladottir, B.A.; Thordarson, T.; Larsen, G.; Sigmarsson, O. (2007). "Survival of the Mýrdalsjökull ice cap through the Holocene thermal maximum: evidence from sulphur contents in Katla tephra layers (Iceland) from the last∽ 8400 years". Annals of Glaciology. 45: 183–188. Bibcode:2007AnGla..45..183O. doi:10.3189/172756407782282516.
- ^ Sigurðsson, Oddur; Williams, Richard S. (2008). "Geographic Names of Iceland's Glaciers:Historic and Modern". In Richard S. Williams Jr.; Jane G. Ferrigno (eds.). Satellite Image Atlas of Glaciers of the World series (U.S. Geological Survey Professional Paper 1386-D (PDF). Retrieved 21 May 2024.
- ^ a b c d e f g h i j McCluskey, O. (2019). Constraining the characteristics of a future volcanogenic Jökulhlaup from Katla, Iceland, through seismic analysis and probabilistic hydraulic modelling, Master’s thesis (Thesis). School of Earth and Environmental Sciences, University of Portsmouth. pp. 1–121. Retrieved 10 June 2024.
- ^ a b c d e f Friis, Bjarki (2011). Late Holocene Glacial History of Sólheimajökull, Southern Iceland (PDF) (Thesis). University of Iceland, Reykjavík. Archived from the original (PDF) on 2014-03-20.
- ^ Humlum, Ole (1985). "Changes in Texture and Fabric of Particles in Glacial Traction with Distance from Source, Mỳrdalsjökull, Iceland". Journal of Glaciology. 31 (108): 150–156. doi:10.1017/S0022143000006390. ISSN 0022-1430.
- ^ Björnsson, Helgi (2017), Björnsson, Helgi (ed.), "Glaciers of Southern Iceland", The Glaciers of Iceland: A Historical, Cultural and Scientific Overview, Paris: Atlantis Press, pp. 211–273, doi:10.2991/978-94-6239-207-6_5, ISBN 978-94-6239-207-6, retrieved 2024-04-26
- ^ a b c Sigurðsson, O. (2010). "5 Variations of Mýrdalsjökull during postglacial and historical times". Developments in Quaternary Sciences. 13: 69–78. doi:10.1016/S1571-0866(09)01305-0.
- ^ Moreland, William Michael; Thordarson, Thor; Houghton, Bruce F.; Larsen, Gudrún (28 August 2019). "Driving mechanisms of subaerial and subglacial explosive episodes during the 10th century Eldgjá fissure eruption, southern Iceland". Volcanica. 2 (2): 129–150. doi:10.30909/vol.02.02.129150. ISSN 2610-3540. S2CID 202923626.
- ^ a b Jaenicke, J.; Mayer, C.; Scharrer, K.; Münzer, U.; Gudmundsson, A. (2006). "The use of remote-sensing data for mass-balance studies at Mýrdalsjökull ice cap, Iceland". Journal of Glaciology. 52 (179): 565–573. Bibcode:2006JGlac..52..565J. doi:10.3189/172756506781828340.
- ^ a b c Björnsson, H. (2003). "Subglacial lakes and jökulhlaups in Iceland". Global and Planetary Change. 35 (3–4): 255–271. Bibcode:2003GPC....35..255B. doi:10.1016/S0921-8181(02)00130-3.
External links[edit]
- http://www.nimbus.it/glaciorisk/Glacier_view.asp?IdGlacier=3965&Vista=paese&Paese=Iceland&IdTipoRischio= (Details of all known Glacier Runs from Mýrdalsjökull)
- http://isafold.de/strutstigur02/img_jokull.htm (Photo of Mýrdalsjökull)
- https://web.archive.org/web/20040504154433/http://volcano.und.edu/vwdocs/volc_images/europe_west_asia/eldgja.html (Volcanism)
- Katla: eruption preparedness for tourists